Reports for Affiliate
To be able to use the platform effectively, Scaleo provides you with a variety of detailed reports on every aspect of the offers you promote. The following guide will walk you through the features and options of Reports available for Affiliates.
You can create detailed reports for a wide range of dates and filter them by multiple breakdowns — parameters that filter out the specific details. They help to deeply analyze the profitability of the particular offer and find out which traffic source is the most effective.
In this article
Available Reports

There are five main report categories: Statistics, Conversions, Clicks, Referrals, and Logs. Each of them provides details on the different parameters of your statistics and traffic within the offer. It will help you to control every step for higher efficiency.
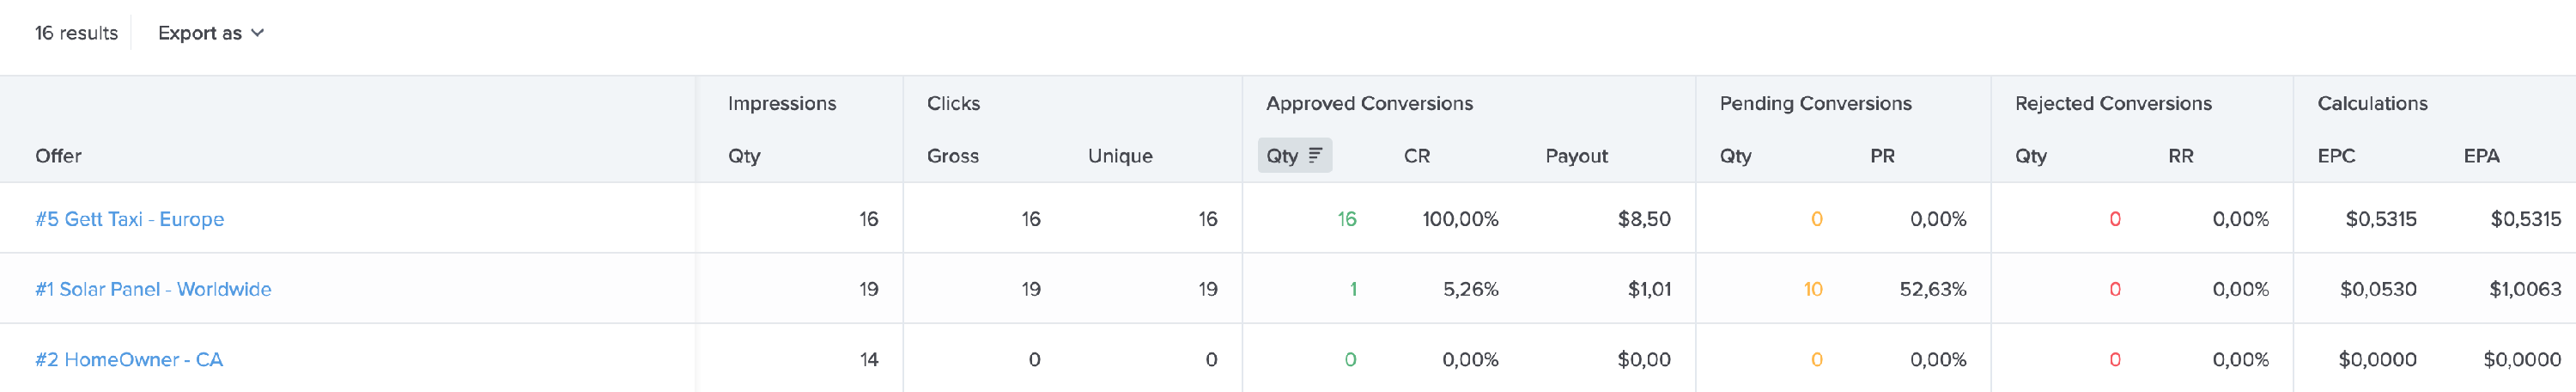
- Statistics — the detailed statistics for the promoted offers. The data is broken up into smaller groups that help to track it by certain parameters.
- Conversions — the full list of conversions made through the platform with their status, offer, goal, payout, etc.
- Clicks — all the clicks registered on Scaleo with details like date, offer, goal, location, IP address, etc.
- Referrals — the list of referrals (new Affiliates brought to the network by this Affiliate) with their rate and commissions, earned from their activity.
- Logs. This section includes two tabs: Invalid Traffic and Postbacks.
- The Invalid Traffic Log allows you to see what traffic and which offers did not match the targeting settings. It can significantly help in the correct traffic setting and save money on the traffic investments.
- The Postback Log displays all the called Affiliate postbacks with their date, offer, goal, URL, and result. This data helps to analyze the correctness of settings, fix if something goes wrong, and make sure that postbacks are correctly sent to the Affiliate's platform.
How to Get a Report
To create a report, go to the Reports page in the sidebar.
Select a report category: Statistics, Conversions, Clicks, Referrals, or Logs.
Set a date range in the pop-up calendar. This option will limit stats by a chosen period. You can select one of the preset parameters or the desired date range. Don’t forget to click the Apply button to save changes.

Select a Breakdown (available just in the Statistics Reports category). Breakdowns allow you to display the report sorted out by the particular parameters, as well as to analyze the efficiency of various traffic sources much better.
Main breakdowns such as Offer, Goal, Day, Hour, Country, Device Type, and Connection Type — are attached to the top panel. The other, custom ones, are added to the Custom tab below. To select an additional value, click Breakdown.

Add Filters. Affiliates can filter data in the table by Offers only and sort the report out by necessary ones. You can select several Offers at the same time. Click Filter by > select Offer > select the necessary Offers in the list > Add Filter.

Select the columns you want to display. They include additional metrics and parameters and depend on the report’s type. When you check the Statistics Reports, all the columns are additionally grouped into several categories.
Click on the Columns button to choose what categories and columns to display, then select all the parameters you need, and click Save. If you leave all the fields in the category empty, the appropriate category will not be displayed in the report.


Once the needed columns are selected, click on Display to generate the report.
If necessary, export the report in CSV or XLSX format.
